A properly balanced hydronic system consistently delivers the appropriate rate of heat transfer to each space served by the system. This objective can be achieved even in systems containing branches that have very different lengths, pipe sizes and heat emitters. Doing so requires proper selection, installation and adjustment of balancing valves.
A balancing valve is an adjustable device that has the ability to vary a fluid passageway, manually or automatically, to alter its hydraulic resistance. This resistance combines with the hydraulic resistance of the pipe, fittings or other devices in the branch to determine that branch's overall hydraulic resistance. The greater the total hydraulic resistance of the branch, the lower the flow rate through it.
This section describes the importance of balancing and the basic criteria used to select the appropriate valve for the project.
Balancing Basics
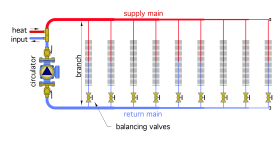
Consider the hydronic distribution system shown in Figure 2-1. This system consists of nine branches connected across common supply and return mains. Circulation is created by a fixed-speed circulator.
This piping arrangement is called a parallel direct return system. For simplicity in understanding the function of balancing valves, assume that all branches have identical piping components, and thus, should (ideally) all operate at the same flow rate and head loss.
The vertical piping near the circulator and the closely spaced tees where heat is added can be considered to have insignificant head loss.
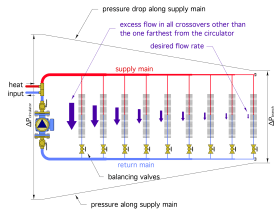
Assume that when this system is first turned on, all the balancing valves are fully open. Because of the head loss along the supply main and return main, the differential pressure exerted across each branch will be different. The “most-favored branch” nearest the circulator will have the highest differential pressure, and thus, the highest flow rate. The “least-favored branch” at the far-right side of the system will have the lowest differential pressure, and thus, the lowest flow rate. This undesirable initial variation in differential pressure across the branches is represented by the sloping lines in Figure 2-2.
The vertical line to the left of the circulator represents the differential pressure established by the circulator. This is the highest differential pressure in the system.
The sloping lines above and below the piping represent pressure drop as flow moves through the supply and return mains. These lines get closer to each other as they progress from left to right. This implies that each branch has less differential pressure across it compared to the branch to its left, which is due to the pressure drop along the mains. Lower differential pressure results in lower flow rate.
The differential pressure available to the “least-favored branch” at the far right of the system determines the flow rate through the branch. In this system, the circulator is assumed to be sized so that it can provide the necessary differential to drive flow through the least-favored branch, accounting for the head loss along the full length of the supply and return mains.
This initial unbalanced condition leads to excess flow in all branches other than the least-favored branch, as represented by the downward arrows. This excessive flow increases the power demand of the circulator, and thus, increases the operating cost of the system. Overflow may also result in unacceptable flow noise and/or corrosion of copper fittings.
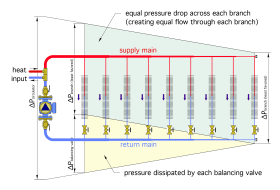
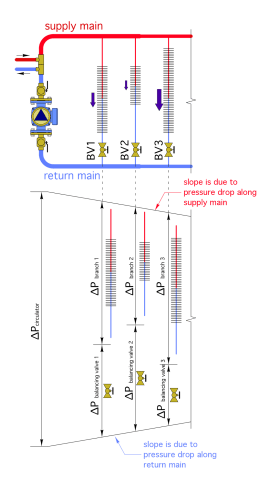
To achieve equal flow in each branch, there must be an equal differential pressure across each branch. This requires the balancing valve in each branch to dissipate the difference between the differential pressure available between the supply and return mains, and the head dissipated by the other piping components in each branch. This concept is represented in Figure 2-3.
The pressure drop that each balancing valve must create is indicated by the vertical height of the yellow shaded area at each branch location. In this system, which assumes identical branch piping, and mains piping that is sized for a consistent pressure drop per unit of length, the required pressure drop of each balancing valve is proportionally less than that of the balancing valve to its left. The balancing valve on the most-favored branch (far left) requires the highest pressure drop, while the balancing valve on the least-favored branch (far right) requires zero pressure drop.
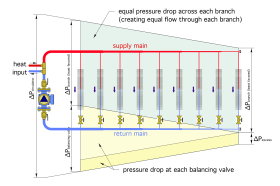
The latter case assumes that the circulator is sized to provide exactly the head required by flow along the full length of the mains and through the least-favored branch. If the circulator supplies higher differential pressure than this requirement (which is often the case), the balancing valve in the least-favored branch will also have to be partially closed to absorb some of this excess differential pressure. This scenario is shown in Figure 2-4.
In some systems, the hydraulic resistance of a given branch may be significantly different from that of the other branches. The design flow rate requirement may also vary from one branch to another. It is still possible to balance such systems for the desired flow rate in each branch. In each case, a properly adjusted balancing valve will absorb the difference between the differential pressure available across the mains at the location of the branch and the differential pressure required to sustain the design flow rate through that branch. The concept is shown in Figure 2-5.
Valve Characteristics
The sections that follow will describe several types of balancing valves. To fully connect how these valves are designed, how they interact with other components, and how they should be sized and selected, it’s important to understand several fundamental concepts. These include flow coefficient, valve authority and equal percentage valve characteristics.
Flow Coefficient (Cv)
All hydronic system components (piping, fittings, valves, heat sources, etc.) that have flow passing through them have hydraulic resistance. That resistance results in a drop in fluid pressure from the inlet to the outlet of the component. The faster the fluid passes through the component, the greater the pressure drop across the component.
There are several methods for estimating the pressure drop of a component based on fluid passing through it at some flow rate. In the case of valves, the relationship between the pressure drop and the flow rate through the valve can be quantified based on Formula 2-1.
Formula 2-1:
$$\Delta P = \left(\frac{D}{62.4}\right) \left(\frac{ƒ}{C_v}\right)^2 $$
Where:
$\Delta P$ = pressure drop across the device (psi)
$D$ = density of the fluid at its operating temperature (lb/ft3)
$62.4$ = density of water at 60°F (lb/ft3)
$f$ = flow rate of fluid through the device (gpm)
$C_v$ = flow coefficient of the valve (gpm)
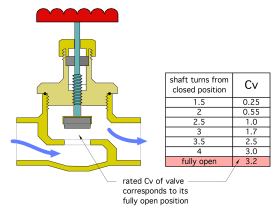
The Cv value can be thought of as the flow rate (in gpm) of 60ºF water that would produce a pressure drop of 1 psi across the valve.
The “rated” Cv value of a valve is based on the valve being fully open (e.g., when the valve’s disc is as far above the valve’s seat as possible). As the valve’s stem is rotated, and the disc gets closer to the seat, the Cv of the valve decreases. The relationship between valve stem position and Cv is sometimes given as a table such as shown in Figure 2-6.
The pressure drop across the valve also depends on the fluid passing through it. Higher density fluids, such as solutions of antifreeze and water, increase the pressure drop across the valve relative to that of water with the same valve stem position valve.
Valve Authority
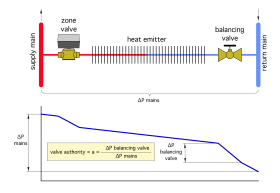
The ability of a manual balancing valve to regulate the branch flow rate depends on the pressure drop across the valve relative to the pressure drop across the entire branch, including the heat emitter, piping, fittings or any other components in the branch. A metric developed to represent this relationship is called valve authority. Figure 2-7 illustrates the concept of valve authority.
The sloping blue line represents the pressure along the branch from its beginning on the left to its end on the right. The slope of the line changes based on the pressure drop through a component or segment of piping within the branch.
The authority of the balancing valve in the branch is the ratio of the pressure drop across it to the overall pressure drop along the branch.
The higher the authority of the balancing valve, the more accurately it can regulate flow through the branch.
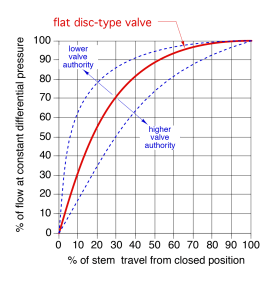
Figure 2-8 shows how valve authority affects the relationship between the stem position of a globe valve and the percentage of flow passing through the valve.
The percent of maximum flow rate versus stem position of a globe valve is not a proportional relationship. As the disc first begins to lift above the set, flow increases rapidly. When the valve stem has reached its 50% open position, the flow rate through the valve, based on the red curve in Figure 2-8, has reached 90%.
Manual balancing valves that have higher authority within a given branch reduce the curvature of the flow versus stem position curve in Figure 2-8.
A general recommendation in any situation where a balancing valve is used to adjust flow rate through a branch is to select the valve so that its pressure drop at full branch flow is at least 50% of the total pressure drop across the branch. This would make the valve authority 0.5.
Equal Percentage Valves
The flow rate versus stem position of a globe valve with a flat disc could be described as a “quick opening” characteristic. Flow rate increases rapidly as the valve’s disc starts to rise above its seat, and flow continues to rise as the disc lifts farther, but at a progressively slower rate. This characteristic is shown in Figure 2-8.
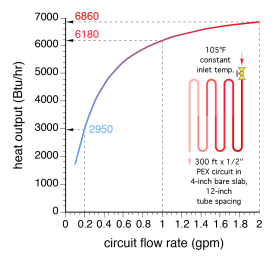
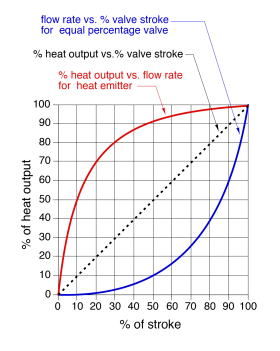
Although a valve with a quick opening characteristic can be used to balance flow rates in hydronic systems, it is not ideal. The underlying reason is that heat output from any type of hydronic heat emitter also increases rapidly at lower flow rates, and more slowly as flow rate increases. This characteristic is shown for a typical radiant floor heating circuit in Figure 2-9.
For more background on heat output from emitters based on flow rate, see: idronics #8
The combination of the flow characteristic for a flat disc globe valve, and the heat output versus flow rate relationship for a heat emitter, result in a very “non-linear” and sensitive relationship between the valve’s stem adjustment and the resulting heat output from the heat emitter.
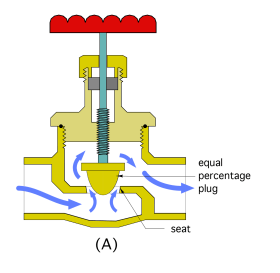
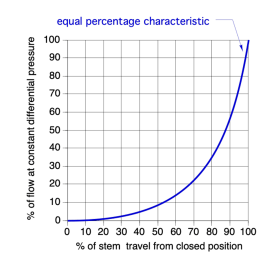
To provide a more proportional relationship between valve stem position and the heat output of the heat emitter being controlled, designers have created valves with different internal “trim.” One of the most common trims gives a valve an “equal percentage characteristic.” Flow through this type of valve increases exponentially with upward movement of the stem. Figure 2-10a shows an example of a manually adjusted equal percentage valve.
Notice the shape of the valve’s plug in comparison to the flat disc used in a standard globe valve. This shape is one way to allow flow to develop slowly as the plug begins to lift above the seat, with progressively high rates of flow rate increasing as the plug lifts higher.
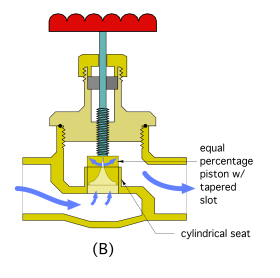
An equal percentage characteristic can also be created using a tapered slot in a piston plug, as shown in Figure 2-10b.
The tapered slot concept is also incorporated in some automated control ball valve designs to provide equal percentage throttling control during the 0-90º rotation of the ball.
Assuming that the differential pressure across the valve is held constant, equal increments of stem movement result in an equal percentage change in the current flow through the valve. For example, moving the stem from 40% open to 50% open, (a 10% change), increases flow through the valve by 10% from its value at 40% open. Similarly, opening the valve from 50% to 60% would again increase flow by 10% of its value at the 50% open position.
When a valve with an equal percentage characteristic regulates flow through a heat emitter, the relationship between stem position and heat output is approximately linear, as shown in Figure 2-12. As the valve begins to open, the rapid rise in heat output from the heat emitter is compensated for by the slow increase in flow rate through the equal percentage valve. As the valve approaches fully open, the slow increase in heat output is compensated for by rapid increases in flow rate. This is a desirable response for both manually operated balancing valves and motorized 2-way control valves.
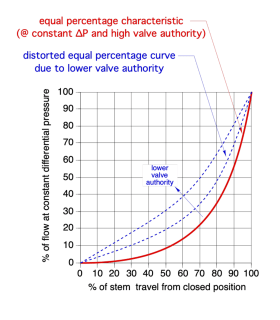
The equal percentage characteristic shown in Figure 2-12 only holds true if the differential pressure across the valve remains constant, and if the valve’s authority, when installed, is at least 50%. If there are variations in differential pressure across a valve as its stem position changes, or if the valve is applied such that it has low valve authority, the curve shown in Figure 2-12 will be distorted in an undesirable direction, as shown in Figure 2-13.
A distorted equal percentage characteristic, although not ideal, is still preferable to a quick-opening characteristic when the valve is used to regulate the heat output of a heat emitter. The overall effect will be a heat output characteristic versus valve stem position curve that is not linear. Heat transfer will increase slightly faster at low flow rates.
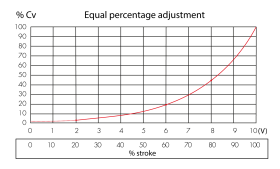
The modern electronics used in some motorized valve actuators can create the desirable equal percentage relationship between flow and stem position of the valve being controlled. One example is the Caleffi proportional 145 Series actuator. When its internal switch is set for equal percentage, the Cv of the valve is mapped to the input voltage of the actuator, as shown in Figure 2-14.
This actuator is one of several that can be fitted to the Caleffi 145 Series pressure-independent control valve, which will be discussed in section 5.
Flows In Parallel Piping Systems
Consider the parallel piping system shown in Figure 2-15. Assume that (initially) all three zone valves and all balancing valves are open. When the fixed-speed circulator is turned on, the flow that develops through each branch depends upon that branch’s hydraulic resistance relative to the hydraulic resistance of the other branches, as well as the hydraulic resistance of the supply and return mains and the heat source. These flow rates may or may not be appropriate to deliver the desired rate of heat to each branch.
If one zone valve is then closed, the flow rates in the other two operating zones will change. It will increase. Likewise, if the setting of any of the three manual balancing valves is changed, the flow rates in any active zone will also change.It’s possible to calculate the flow rates that will occur in any of the branches based on the status of the zone valves and the settings of the balancing valves. However, those calculations can be complex, especially for larger systems with many branches. Such calculations are typically done using computer models of the piping system.
Regardless of what the branch flow rates are, it’s important to understand that any changes to the status of the zone valves or the settings of the balancing valves will have some effect on the flows in all the branches. This characteristic is undesirable, especially if the intent of adjusting one of the balancing valves is to change the flow rate in its associated branch without affecting the flow rates in any other branch.
Still, this is the reality of attempting to establish specific flow rates in each branch that will remain at those specific values as zone valves within the system open and close. This is an inherent limitation of static balancing using any type of manual balancing valve, as it cannot react to changes in other branches of the system, and thus, cannot hold a specific flow rate in any situation other than that which existed when it was last adjusted.
For more information on different types of parallel hydronic distribution systems, see idronics #8.


