PREFACE
Acceptable water pressure within a building’s freshwater distribution system is generally in the range of 20 to 80 PSI, as documented in the International Plumbing Code and the Uniform Plumbing Code. This pressure range is well-suited to the piping, fittings, valves and other components used in modern building water distribution systems.
If the water pressure available at a plumbing fixture such as a faucet or shower head is too low, the flow rate from that fixture will also be low. This will inevitably lead to frustration and complaints.
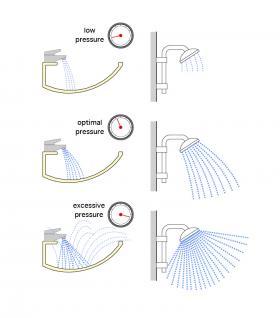
When the water pressure at a fixture is too high, water will be splashed from the bowl of the sink onto the person using the sink and surrounding surfaces, as shown in Figure 2-1. Flow from shower heads operating at excessively high pressure can also be scattered and uncomfortable.
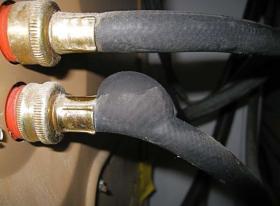
Higher-than-necessary water pressure is also much more likely to cause water waste, leading to higher water and sewer bills, and adding to water shortages in many areas of North America. Excessive water pressure also increases stress on plumbing system components, as seen in Figure 2-2.
One key consideration in designing a building plumbing system that maintains acceptable pressure at fixtures is the pressure available at the location where water enters the building. Pressures that are either too high or too low at the point of entry can be caused by several factors.
LOW-PRESSURE SUPPLY SCENARIOS
The water pressure at the entry point to a building can be low for several reasons.
- If a municipal water distribution system expands to new neighborhoods, the increased flow required through existing piping leads to higher dynamic pressure losses, and subsequently lower pressure, especially at the outer extents of the distribution network. Such situations can be corrected by installing larger distribution piping or adding booster pumps, but the cost and complexity of doing so often delays or precludes such improvements.
- Many water systems in older American cities have antiquated piping materials in different parts of their distribution network. Boston, for example, has large cast iron pipes in its distribution network that are over 100 years old. These pipes, and the joints connecting them, develop leaks as a result of corrosion, breakdown of sealing systems, mechanical stress associated with underground installation, or frost penetration. Those leaks create constant water loss, which increases water flow rates through the distribution network and subsequent drops in the pressure available to buildings connected to that network. Aging pipes that operate at higher flow velocity due to an increase in the number of buildings served by the distribution network are also more prone to leaks due to metal erosion, further exasperating the problem.
- Aging water distribution piping can also accumulate scale or sediment that inhibits flow, and thus reduced water pressure, especially under high demand scenarios such as “wake-up” time in large residential neighborhoods.
- Severe drought conditions that significantly lower water levels in reservoirs can also reduce the pressure available in municipal water distribution systems.
HIGH-PRESSURE SUPPLY SCENARIOS
Water pressure at the point of entry to a building can also be too high for several reasons.
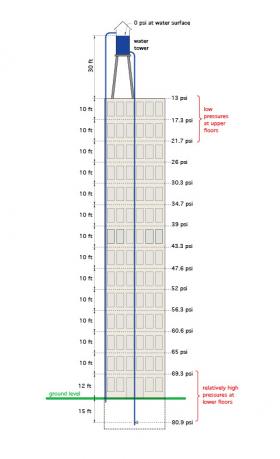
Older, gravity-driven water distribution piping was once commonly used in multi-story buildings. These systems, some of which are still in operation, had one or more large water storage tanks on their roof, as seen in Figure 2-3.
These tanks provided a volume buffer to compensate between the rate of water use in the building, and the rate at which water could be supplied to the building from a municipal system.
They were covered to reduce the potential for contamination, but they were not pressurized. The upper surface of the water in the tank remained at atmospheric pressure.
Without proper compensation, these systems create different water pressure at each floor level, as illustrated in Figure 2-4.
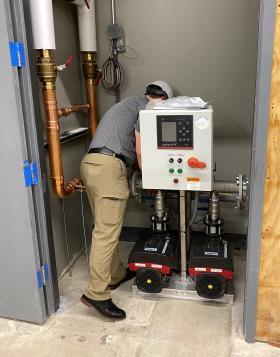
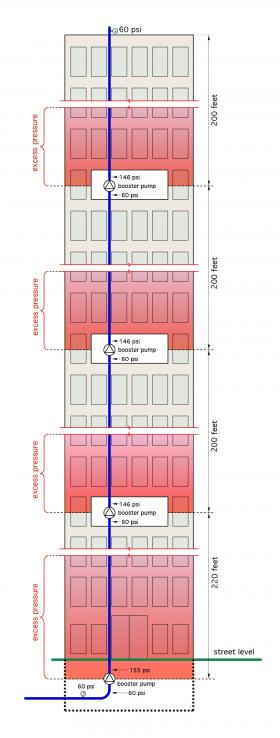
In very tall buildings, there may be several pressure boosting systems piped in series with each other.
These systems, if installed without pressure reducing valves, can cause excessive water pressure in piping that’s several floors above each booster pump, as shown in Figure 2-6.
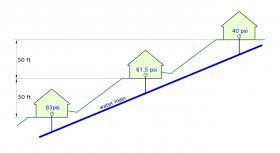
Elevation changes in a municipal water distribution network can also cause complications.
In hilly or mountainous regions, water pressure between several buildings on a steep slope can vary over a wide range, as see in Figure 2-7.
These towers buffer the rate of water demand in a municipal water system with the rate of water availability from wells or other sources.
They can be 100 feet or more above ground level and are typically supplied by one or more pumps.
Variations in water level within these towers can create changes in water main pressure, and thus changes in the pressure at the point of entry to buildings.
STATIC VERSUS DYNAMIC WATER PRESSURE
When discussing water pressure in piping systems, it is necessary to distinguish between static pressure and dynamic pressure.
Static pressure occurs when the water in the piping system is not moving. For example, if all the water fixtures in a building are off, the pressure in all parts of the building’s piping system are at static pressure.
If the static pressure at one location in the system is known, the static pressure in other locations within the system are easily calculated using Formula 2-1.
Formula 2-1:
$$ P_S = P_{SR} \pm 0.43 \times (h) $$
Where:
$P_S$ = static pressure at some location (psi)
$P_{SR}$ = known static pressure at a reference location in the system (psi)
$h$ = height of the location where static pressure is to be determined relative to the height of the reference location (feet)
$0.43$ = a constant based on cold water
When the location where the static pressure is to be determined is above the reference location, the sign in Formula 2-1 is negative (e.g., $P_S = P_{SR} - 0.43 \times h$).
For example, consider an eight-story building where the water pressure at the point of entry is 55 psi. The static pressure at a faucet located 80 feet above the point of entry would be $55-0.43 /times (80) = 20.6 \text{psi} $.
When the location where static pressure is to be determined is below the reference location, the sign in Formula 2-1 is positive (e.g., $P_S = P_{SR} + 0.43 \times h$).
For example, consider a faucet in the underground parking garage of the same eight-story building. Assume that faucet is 20 feet below the point where the water main enters the building, and where the corresponding static pressure is 55 psi. The static pressure at that faucet would be $55 + 0.43 \times (20) = 63.6 \text{psi}$.
Dynamic pressure is the pressure at a location in the system when the water is moving. Dynamic pressure is always lower than static pressure. The decrease from static pressure to dynamic pressure is caused by friction between water molecules, as well as between those molecules and piping surfaces. The faster water moves through piping or piping components such as fittings and valves, the greater the drop in pressure.
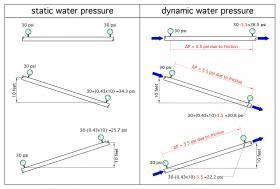
Figure 2-10 illustrates the concepts static and dynamic pressure along pipes that are horizontal or sloping.
Notice that the combined effects of static pressure and dynamic pressure are seen in the sloping pipes that have water flowing through them. In the case of water flowing up the sloped pipe, pressure decreases due to gain in elevation (e.g., change in static pressure), as well as pressure drop due to friction (e.g., dynamic pressure loss).
The change in pressure from static to dynamic explains why a fixture might emit a sudden short “burst” of water when it is first opened. The static pressure present before the fixture is opened immediately changes to a lower dynamic pressure due to friction in the piping leading to the fixture. This causes an immediate drop in water flow rate.
Water hammer is also caused by a sudden change from dynamic to static pressure. When a faucet or other valve is quickly closed, the kinetic energy of the water moving through the piping is immediately converted to a “spike” in static pressure. In some instances, that pressure spike can damage components in the system or even cause a pipe to burst. Water supply systems operating at higher than necessary pressure are more prone to water hammer. Systems that use fast-acting, solenoid-operated valves to allow or prevent water flow are also more prone to water hammer.
The drop in pressure due to friction (e.g., dynamic pressure loss) is also why the pressure in a municipal water system can vary with time of day. When there is a high demand for water in a neighborhood, such as during wake-up time or dinner time, higher flow rate through the water mains serving that neighborhood increases dynamic pressure loss.
CALCULATING DYNAMIC PRESSURE DROP
There are several methods for calculating the dynamic pressure drop associated with water flowing through piping. The Hazen-Williams equation is the “classic” method for making such calculations. A special form of the Hazen-Williams equation for use with copper tubing is given in Appendix B.
STABILIZING PRESSURE IN WATER DISTRIBUTION SYSTEMS
Thus far, the ability to increase water pressure by increasing the elevation of the water source relative to where the water is used, or through use of pressure boosting pumps, has been discussed. However, a far more common situation involves reducing water pressure, from the point of entry to a building to the point where water is discharged from plumbing fixtures or into an appliance.
Although it is possible to use globe-type valves to create a drop in dynamic pressure, such valves cannot reduce static pressure. They are also incapable of compensating for variations in upstream pressure. As such, manually adjusted globe valves are not a good choice for pressure regulation in domestic water distribution systems.
PRESSURE REDUCING VALVES - OPERATING CONCEPTS
The need for consistent pressure regulation in water supply systems prompted the development of specialty valves that can automatically maintain a steady and selectable downstream pressure, while also compensating for variations in upstream pressure.
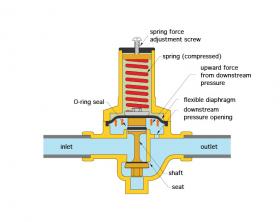
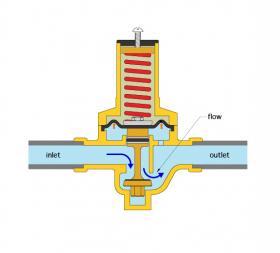
The first versions of such valves date back to the early 1900s. The underlying concept involved an adjustable spring opposing the force created by water pressure against a flexible diaphragm, as represented, in simplistic form, in Figure 2-11.
Water at higher pressure is available at the valve’s inlet. The valve’s outlet supplies the lower pressure portion of the system. The water pressure present at the outlet presses upward against the flexible diaphragm. Whenever this upward force exceeds the downward force created by the spring, the valve’s disc is closed against its seat, and no water passes through the valve. This design concept is referred to as a “direct-acting” pressure reducing valve.
When the pressure at the valve’s outlet decreases, such as when water is drawn from a plumbing fixture, the upward force created by this pressure acting on the diaphragm also decreases. When this upward force becomes less than the downward force created by the spring, the valve’s shaft is pushed downward, moving the disc away from its seat and allowing water flow from the inlet to the outlet, as shown in Figure 2-12.
Flow continues until the pressure on the outlet side rises sufficiently to cause the force generated against the diaphragm to exceed the downward force of the spring. This condition causes the disc to close against its seat.
The pressure setting where the valve begins to allow flow is adjusted by a threaded shaft or screw at the top of the valve. When this screw is adjusted downward, the force generated by the spring increases, and so does the pressure setting of the valve.
PISTON-TYPE PRESSURE REDUCING VALVES
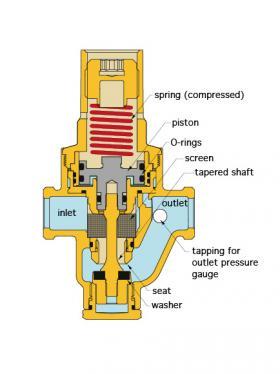
Another type of direct-acting pressure reducing valve that’s designed for high inlet water pressure uses a piston rather than a flexible diaphragm, as illustrated in Figure 2-14.
Similar in concept to diaphragm-type PRVs, piston-type PRVs use opposing forces created by downstream water pressure and an internal spring. Downstream pressure pushes upward against the piston to oppose the (adjustable) downward force created by the spring. O-rings provide the seal between the piston and its surrounding cylinder.
When downstream pressure decreases, the spring pushes the piston downward allowing flow through the valve. Caleffi piston-type PRVs use a specially tapered shaft to reduce pressure drop as flow passes through the valve’s seat.
When downstream pressure rises to the valve’s setting, the upward pressure force against the piston counteracts the downward force of the spring, causing the valve to close.
Piston-type PRVs perform well in systems prone to water hammer. Frequent water hammer can be caused by solenoid valves opening and closing, say in a commercial laundry washing machine or in automated irrigation systems, as two examples. The pressure spikes created by such water hammer can eventually damage diaphragm-type PRVs.
PILOT-OPERATED PRESSURE REDUCING VALVES
The PRVs described thus far are categorized as “direct-acting.” The position of the valve’s shaft is entirely determined by the upward pressure of water on the downstream side of the valve, versus the downward force created by the valve’s spring.
While direct-acting PRVs are suitable for most applications using pipe sizes of 2 inches or less, there are situations where pressure stabilization is required in applications with high flow rates. Examples include large commercial or industrial process applications, or firefighting applications.
Another type of valve, known as a “pilot-operated” PRV, is well-suited to such high flow situations.
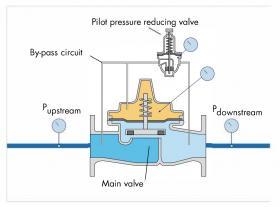
Pilot-operated PRVs, which are often referred to as “automatic control valves,” or designated as (ACV) on piping schematics, are a combination of two interconnected valves, as shown in Figure 2-15.
The small “pilot” PRV senses pressure upstream and downstream of the larger valve. However, unlike the design of a direct-acting PRV, the upstream pressure is also transferred to a pressure-tight chamber on the upper side of the diaphragm in the larger valve. This creates a downward force on the diaphragm, which acts to close the disc of the larger valve.
When the downstream pressure drops, flow passes through the pilot PRV. This causes some water to leave the upper chamber in the larger valve, allowing its shaft to move upward and flow to pass through.
When the downstream pressure rises to the setting of the pilot PRV, it closes. The upstream pressure increases, forcing more water into the upper chamber of the large valve. This, in turn, causes the diaphragm to move down, reducing or stopping flow through the larger valve.
Pilot-operated PRVs are an example of “pressure balanced” valves. Fluid pressure acting on the diaphragm in the upper chamber helps to balance the opposing forces created by upstream pressure acting upward on the valve’s disc. This helps stabilize valve stem movement.
One distinguishing characteristic of pilot-operated PRVs is an insignificant drop in downstream pressure over a wide range of flow rates.
PERFORMANCE OF PRESSURE REDUCING VALVES
A hypothetically “perfect” pressure reducing valve would maintain its set outlet pressure regardless of the flow rate passing through it. Although design refinements have moved production valves closer to this ideal, all direct-acting pressure reducing valves experience some “fall off” in the downstream pressure as flow through the valve increases. This pressure drop is caused by the same dissipation of hydraulic head energy that occurs through any type of valve used in a hydronic heating or cooling system.
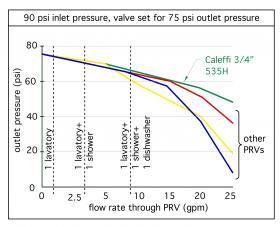
Figure 2-16 shows a comparison between the outlet pressure maintained by a Caleffi 535H valve and several other PRV products, as a function of water flow through those valves.
At low flow rates, most of the valves represented can accurately maintain the set outlet pressure. However, as additional fixtures or appliances start to draw water through the valve, the ability of the valve to maintain its set outlet pressure drops. Of the valves represented in Figure 2-16, the Caleffi 535H has the least “fall off” in outlet pressure at the higher flow rates. This is in part due to the tapered shaft design, which reduces frictional losses through the valve.
PRESSURE REDUCING VALVE SIZING
All valves must be sized correctly for optimal performance. The starting point is to determine the design water flow rate through the valve based on the downstream fixture demand. The connection pipe size of Caleffi pressure reducing valves should then be selected so that the design flow rate corresponds to a flow velocity between 3 to 6 feet per second.
This range of flow velocities allows the valve to operate with minimal sound. It also increases the life of components that could be damaged over time by operating at excessively high flow velocity. The table in Figure 2-17 can be used to match the pipe size of the Caleffi 535H series valves to a design flow rate.
PRESSURE REDUCTION RATIO
Pressure reducing valves are designed to maintain relatively stable outlet pressure over a range of inlet pressures. However, there are limitations that must be respected to maintain quiet operation and ensure longer service life. One of those limitations is pressure reduction ratio, which is simply the maximum inlet pressure at which the valve is applied, divided by the minimum outlet pressure it is expected to maintain.
Pressure reduction ratios of 2:1 are fine. Slightly higher ratios are possible but should never exceed 3:1.
$$ \text{Pressure reduction ratio} = {\text{maximum inlet pressure (psi)} \over \text{minimum outlet pressure (psi)}} $$
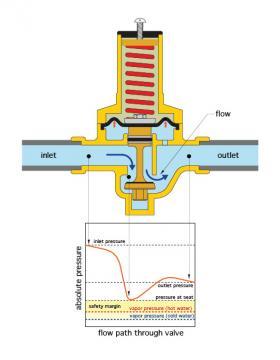
Applying any pressure reducing valve at an excessively high-pressure reduction ratio will cause cavitation within the valve and noise. Over time, such cavitation can cause erosion and eventual failure. Figure 2-18 illustrates how the pressure of water changes as it flows through a pressure reducing valve.
Notice the sharp drop in pressure as water passes through the valve’s seat. To prevent cavitation, the pressure at the valve’s seat must remain above the vapor pressure of the water. The smaller the pressure reduction ratio, the greater the safety margin against cavitation. This is especially important when using a PRV with hot water, since vapor pressure increases with increasing temperature.
MANAGING HIGH PRESSURE REDUCTION RATIOS
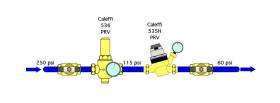
When the required pressure reduction ratio is greater than 3:1, the solution is “2-stage” pressure reduction. This involves two pressure reducing valves connected in series, as shown in Figure 2-19.
The scenario shown in Figure 2-19 uses a Caleffi 536 PRV to reduce the incoming pressure from 250 to 115 psi. The pressure reduction ratio is 250/115 = 2.17, which is fine.
The 115 psi present at the inlet of the Caleffi 535H PRV is further reduced to 60 psi. The pressure reduction ratio is 1.92, which is also fine.
When connecting PRVs in series, the piping between the valves should be as short as possible. This minimizes the fluid volume between the valves, which could undergo pressure changes due to thermal expansion.
MINIMUM FLOW RATES FOR PRESSURE REDUCING VALVES
Another important selection criterion is the minimum flow rate at which the valve is expected to maintain its set output pressure. The Caleffi guideline is that the minimum flow rate should correspond to a flow velocity of 1.0 feet per second. Figure 2-20 shows flow rate corresponding to 1 foot per second for copper tubing in sizes from 1/2-inch to 2-inch.
MANAGING A WIDE RANGE OF FLOW RATES
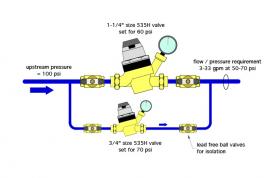
It is common to encounter situations in which the range of possible water flow rates is wider than the rated operating range of a single pressure reducing valve. For example, consider a flow rate range of 3 to 33 gallons per minute. The maximum flow rate could be handled by a 1.25-inch Caleffi 535H PRV. However, the lower end of the range — 3 gpm — is less than the minimum flow rate for the 1.25-inch valve. A 3/4-inch or 1-inch PRV could handle the minimum flow rate, but neither are rated to handle 33 gallons per minute.
The solution to this situation is to install two pressure reducing valves of different size in parallel, as shown in Figure 2-21.
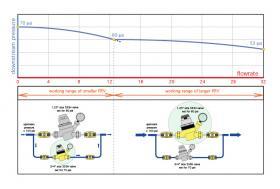
When the downstream flow is about 3 gpm, the smaller PRV handles pressure regulation, maintaining a downstream pressure of about 69 psi. The upper valve is not passing any flow since the downstream pressure is currently above its setting of 60 psi.
As the downstream flow requirement increases, the pressure drop (e.g., “fall-off” pressure) across the smaller valve increases. At 12 gpm flow, the fall-off pressure across the small valve is about 9 psi. If the larger valve is set for 60 psi, it is on the verge of opening.
Any further increase in flow will allow the larger valve to operate, and initially maintain downstream pressure at or slightly below 60 psi. If flow reaches approximately 32 gpm, the large valve will stabilize downstream pressure at about 53 psi. The 7 psi drop below its setting is again due to “fall off” caused by increasing flow rate. Figure 2-22 shows this overall flow rate versus downstream pressure example.
In this example, the downstream pressure varied from about 70-53 psi, which is within the specified acceptable range of 50-70 psi.
Lead-free ball valves are shown on both sides of both pressure reducing valves. These allow each valve to be isolated and serviced if necessary. Typical servicing includes checking the internal screen and valve seat, and cleaning them when needed. The ball valves also allow either PRV to be isolated for replacing the internal pressure regulating assembly, if ever necessary.
It’s possible to create systems with more than two PRVs in parallel. This allows a narrower range of downstream pressure regulation, but also adds to installation cost.

