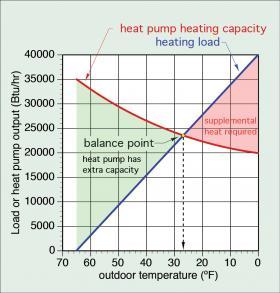
A common way to compare the heating output of an air-source heat pump to a building’s heating load is to plot the heat pump’s heating capacity and the load as a function of outdoor temperature. Figure 5-1 shows an example.
The heating load, represented by the blue line in Figure 5-1, is assumed to increase linearly as the outdoor temperature drops. The heating capacity of a representative air-source heat pump, represented by the red curve in Figure 5-1, decreases as the outdoor temperature drops. The point where the load line and heating output curve cross is called the balance point. This is where the heating output of the heat pump exactly equals the load. For the scenario shown in Figure 5-1, this occurs at an outdoor temperature of about 27ºF, and a corresponding heat transfer rate of about 24,000 Btu/hr.
The green shaded area to the left of the balance point represents conditions where the heat pump has excess heating capacity relative to the load. Heat pumps with single speed compressors would cycle on and off under these conditions to avoid overheating the building. Heat pumps with variable-speed compressors will typically reduce heating output to match the load under these conditions.
The red shaded area to the right of the balance point represents conditions where there is insufficient heat output from the heat pump to meet the load. Some heat pumps would be operating continuously under these conditions, with the “deficit” between heat output and heating load provided by a supplemental heat source. Other heat pumps might turn off at some lower limit of outdoor temperature. In this case, all the heat required by the building would have to come from a supplemental heat source.
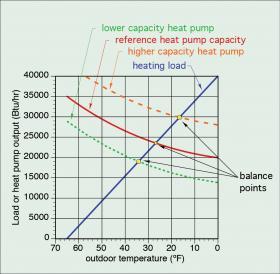
If a heat pump with a higher heating capacity is used, the heating capacity curve would shift upward and the balance point would shift to a lower outdoor temperature. If a heat pump with a lower heating capacity was used, the red curve would shift down, and the balance point would shift to a higher outdoor temperature. These effects are illustrated in Figure 5-2.
It’s somewhat intuitive that selecting a heat pump with a larger heating capacity will reduce the amount of supplemental heating required. For the heat pumps assumed in Figure 5-2, the heat pump with the higher heating capacity shifted the outdoor balance point from about 28ºF down to about 16ºF. Still, this information is not, by itself, helpful in answering questions about seasonal heating performance, such as:
• How much of the building’s seasonal heating requirement can be supplied by a given heat pump?
• How should the heat pump’s heating capacity compare to the design load of the building?
• How does the cost of supplying heat using the heat pump compare to another fuel option, such as natural gas?
• How does the variation in the heat pump’s heating capacity and COP affect its seasonal performance in a given system installed at a specific location?
To show how these questions can be addressed, consider the following example.
A house located near Boston, MA, has a design heat loss of 75,000 Btu/hr. The house has a low-temperature hydronic distribution system that can supply design heating load using a supply water temperature of 120ºF. The water temperature supplied to the distribution system is based on full-range outdoor reset control. At outdoor temperatures above 65ºF, the net heating load is zero due to internal heat gains. A low-ambient air-to-water heat pump having the performance shown in Figure 2-15 is being considered for use in this house. Determine the balance point for this house and heat pump. Also determine what percentage of the seasonal heating energy can be supplied by this heat pump. Compare the cost of operation of the heat pump system to that of a natural gas boiler using local utility rates.
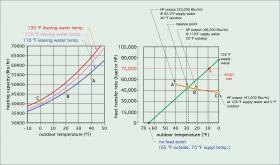
Figure 5-3 shows the heating capacity graph from Figure 2-15 alongside a graph showing the supply water temperature required based on outdoor reset control. This graph also shows a portion of the heating capacity curve for the heat pump.
The heating capacity curve shown in orange on the right side graph was generated by determining the heat pump’s heating capacity at three randomly selected outdoor temperatures (0ºF, 20ºF and 40ºF), and at the supply water temperature required by the hydronic distribution system at those outdoor temperatures (e.g., based on outdoor reset control).
These temperature combinations are represented by points A, B, and C in both graphs. Some interpolation between the three capacity curves was required. The green line on the right side graph is the outdoor reset line for supply water temperature.
In this case, the balance point temperature is about 28ºF. When the outdoor temperature is warmer than 28ºF, the heat pump has more than sufficient capacity to meet the house’s heating load. When the outdoor temperature is lower than 28ºF, some amount of supplemental heat will be required. Taking this analysis further requires data for outdoor temperatures over the heating season.


