TEMPERATURE & HUMIDITY INDICES
Air is a combination of gases including oxygen (21%), nitrogen (78%), and small amounts of carbon dioxide, hydrogen and neon. Most air — with the exception of what is possible in a laboratory — contains water vapor.
All cooling systems create changes in the temperature and water vapor content (e.g., humidity) of interior air. Most cooling systems attempt to maintain the temperature and humidity of interior air at some set combination of conditions deemed to provide human comfort during warm weather. A typical combination would be an interior air temperature of 75ºF and an interior humidity level of 50% during cooling season operation.
To appreciate how any cooling system affects the temperature and humidity of interior air, it’s necessary to understand several specific physical quantities that are used to quantitatively describe the condition of air. Those physical quantities include:
• dry-bulb temperature
• wet-bulb temperature
• dewpoint temperature
• relative humidity
• absolute humidity (aka humidity ratio)
DRY-BULB TEMPERATURE
One of the simplest indexes that describe the condition of air is called dry-bulb temperature. It’s simply the temperature of air read from a thermometer after the thermometer has stabilized within an interior or exterior space. The word “bulb” makes reference to mercury bulb thermometers that were extensively used for most air temperature measurements prior to development of electrically based temperature sensors such a thermocouples, thermistors and resistance temperature detectors (RTDs).
WET-BULB TEMPERATURE
Anyone who has ever stood in a wind while wearing wet clothes can attest to the cooling effect created as the moving air causes water to evaporate from those clothes. This same effect (e.g., cooling caused by evaporating water) can be used to determine the amount of moisture contained in air.
The classic method of doing so is to place a small cotton “sock” over the bulb of a mercury thermometer, saturate the sock with water, and then pass the thermometer through the air at a speed that expedites evaporation from the sock. After approximately 30 seconds, the moisture content of the sock will stabilize at a saturation condition, which implies that no further evaporation can occur. At that point, the thermometer with the sock over its bulb indicates the air’s wet-bulb temperature.
The classic device for determining wet-bulb temperature, as well as dry-bulb temperature, is a sling psychrometer, an example of which is shown in Figure 4-1.
This instrument has two identical thermometers mounted side by side on a plate. The plate is mounted to a small shaft that extends to a handle. The person using the instrument first wets the small cotton sock stretched over the bulb of one thermometer. They then use the handle to spin both thermometers around the shaft for about 30 seconds. This causes the water on the sock to evaporate until its moisture content reaches that of the surrounding air. The evaporation of water from the sock cools the thermometer’s bulb to a stable value, which is the air’s current wet-bulb temperature.
The recorded dry-bulb and wet-bulb temperatures can be used along with a psychrometric chart to determine several indices related to the moisture content of the air. Psychrometric charts are described later in this section.
DEWPOINT TEMPERATURE
The ability of air to contain water vapor is very dependent on the air’s temperature. The warmer the air, the greater its ability to contain water vapor. If a given sample of air is progressively cooled to lower and lower temperatures, it eventually reaches a saturation condition at which it contains all the water vapor it’s capable of holding. The temperature at which this condition occurs is called the dewpoint of the air.
The dewpoint temperature is very important in the design and operation of cooling systems. For example, if air contacts a surface that cools it to (or below) its dewpoint temperature, water vapor in the surrounding air will condense into liquid water on that surface. A glass containing a cold drink and surrounded by warm/moist air is a common example of such condensation, as shown in Figure 4-2.
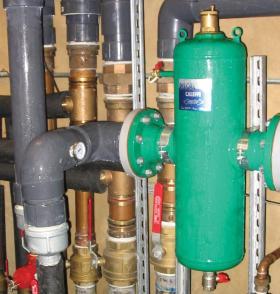
The formation of condensation is very desirable when it occurs intentionally, such as on the surfaces of a chilled-water coil within an air handler. This dehumidification is the intended action. However, unintentional condensation on surfaces of piping, circulator volutes, ducting or valves is a condition that must be avoided. If allowed to occur, the condensation can quickly create stains or oxidize steel and cast iron surfaces. Figure 4-3 shows a portion of a commercial chilled-water system that includes uninsulated CPVC pipe and a steel air/dirt separator. Both the piping and separator are covered with condensate. Repeated formation of condensate will eventually cause surface oxidation and staining of the floor under steel or cast iron components. Repeated formation of condensation can also encourage mold growth, and eventually destroy materials such as wood and drywall.
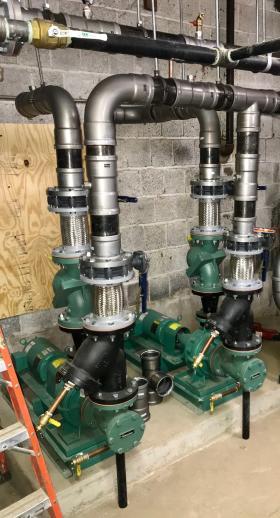
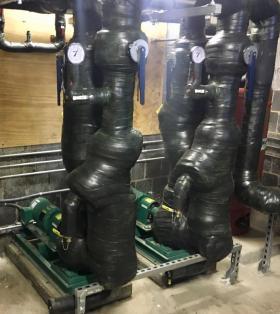
Most chilled-water cooling systems operate at water temperatures that are well below the dewpoint of surrounding air. To prevent surface condensation, all piping components in contact with chilled water must be insulated and that insulation must be vapor sealed. Figure 4-4 shows a pair of base-mounted circulators that are part of a commercial chilled-water cooling system. After all piping components were assembled and pressure tested, they were carefully insulated with an elastomeric foam. Note that the circulator motors and coupling assemblies are not — and never should be — insulated, to prevent heat buildup.
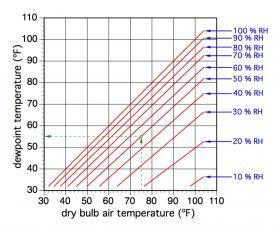
The dewpoint temperature of air is generally considered the same as the air’s current wet-bulb temperature and can be read from a psychrometric chart. It can also be read from Figure 4-5 based on the air’s dry-bulb temperature and relative humidity.
ABSOLUTE HUMIDITY
There are several indices used to represent the amount of water vapor contained in air. One that is particularly useful for cooling system design is called absolute humidity. It is commonly expressed as the pounds of water contained in one pound of dry air. Perfectly dry air would have an absolute humidity of 0. However, perfectly dry air is not naturally occurring. Air at 70ºF and 50% relative humidity has an absolute humidity of 0.0078 lb/lb indicating that one pound of air at this condition contains 0.0078 pounds of water, and 0.9922 pounds of the gases that make up air.
Absolute humidity is also sometimes stated in grains of water per pound of dry air. There are 7000 grains in one pound. So, air at 70ºF and 50% relative humidity also has an absolute humidity of about 55 grains per pound of dry air. The absolute humidity of air can be read from the vertical right side axis of a psychrometric chart. Another term sometimes used for absolute humidity is “specific humidity.”
RELATIVE HUMIDITY
When people discussing weather talk about “humidity” they are usually referring to relative humidity. This is simply the ratio of the actual water mass in a given mass of air divided by the maximum mass of water the air could hold at its current temperature. Thus, air at 60% relative humidity only contains 60% of the water vapor that it is capable of holding at that temperature. A relative humidity of 100% means that the air is saturated and holding the maximum amount of water possible given the air’s temperature. Air reaches 100% relative humidity at the dewpoint temperature. Relative humidity is plotted as a series of curves on a psychrometric chart.
PSYCHROMETRIC CHART
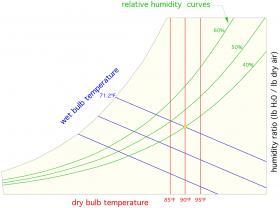
Willis Carrier is considered by most historians as “the father of air conditioning.” In 1905, Carrier developed the first psychrometric chart that quantified the properties of air. That chart has been refined since its inception, but modern versions still bear a close resemblance to the original chart developed over a century ago. A full psychrometric chart is provided in appendix B. Several websites also have this chart available. Figure 4-6 shows a limited approximation of the psychrometric chart.
All the previously discussed thermodynamic properties of air are represented on a modern psychrometric chart. Dry-bulb air temperatures are listed along the chart’s bottom horizontal axis (shown in red in Figure 4-6). Wet-bulb temperatures are listed along the curved upper left side of the chart (shown in blue in Figure 4-6). The relative humidity of the air is indicated by the curve that span from lower left to upper right (shown in green in Figure 4-6). The absolute humidity (lb H2O/lb dry air) is listed along the right side vertical axis of the chart. Lines are drawn perpendicular to the bottom and right side axes, allowing dry-bulb temperature and absolute humidity values to be projected into the field of the chart. Sloping lines are also drawn from the wet-bulb temperatures indicated on the chart’s upper left curved edge.
When any two of the thermodynamic properties plotted on this chart are known, the remaining properties can be determined. For example, if the dry-bulb and wet-bulb temperature of the air are known, the psychrometric chart can be used to find relative humidity and absolute humidity.
Some psychrometric charts also plot the density of air, the enthalpy of the air when fully saturated with moisture, and an index called sensible heat ratio.
SENSIBLE HEAT RATIO
As previously mentioned, all building cooling loads consist of sensible cooling (e.g., a measurable drop in dry-bulb temperature), and latent cooling (e.g., moisture removed from air). Different types of cooling systems, operating in different locations, need to operate at different proportions of these two load components. For example, a cooling system removing heat from a computer server room in an arid climate such as Santa Fe, NM, operates at a very high percentage of sensible cooling — likely 90+ percent. A commercial kitchen in New Orleans, LA, will face a much different cooling load, perhaps 60%sensible cooling and 40% latent cooling.
An index called sensible heat ratio has been developed to assess these different proportions of sensible and latent cooling load. The sensible heat ratio is defined as the sensible portion of the cooling load, divided by the total cooling load, which can be mathematically expressed as Formula 4-1:
Formula 4-1:
$$SHR={q_s \over q_T}={q_s \over q_s+q_L}$$
Where:
$SHR$ = sensible heat ratio (unitless
decimal number between 0 and 1)
$q_s$ = sensible cooling load (Btu/hr)
$q_T$ = total cooling load (Btu/hr)
$q_L$ = latent cooling load (Btu/hr)
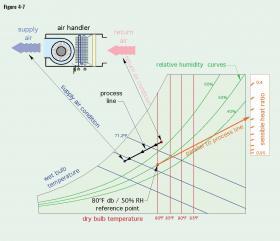
It is possible to determine the sensible heat ratio of a specifically defined cooling process using a psychrometric chart. The cooling process is usually defined starting with the condition of air returning from a space being cooled. That condition can be a combination of dry-bulb and wet-bulb temperatures, or a combination of either the wet-bulb temperature or the dry-bulb temperature, along with a known relative humidity. This combination establishes a point on a psychrometric chart. Another point on the chart is established based on the desired condition of the air supplied to the space being cooled. A line is drawn between these two points. That line is called the process line. An example of a psychrometric process line is shown in Figure 4-7.
The sensible heat ratio is found by constructing another line, parallel to the process line, and passing through a reference point defined as (80ºF db/50% RH) on the psychrometric chart. The parallel line is extended to the upper right portion of the chart and passes through a scale labeled sensible heat ratio (or sometimes labelled sensible heat factor).
Knowing the sensible heat ratio helps determine the type of cooling equipment used. Cooling scenarios with high SHR are well-suited to cooling using thinner cooling coils, radiant panels or chilled beams. Cooling scenarios with low SHR will require significantly more dehumidification and favor thicker, multi-row cooling coils.
COOLING LOADS
The starting point for designing any chilled-water cooling system is to establish the building’s cooling load. Those loads involve several influencing factors, each of which can change with time. These include:
• Building occupancy
• Solar heat gain through windows and opaque exterior surfaces of buildings
• Operation of interior equipment (computers, office machines, production equipment, cooking, etc.)
• Lighting schedules
• Ventilation requirements during occupied and unoccupied periods
• Building thermal mass
• Combined temperature and humidity (e.g., enthalpy) of outside air
Some of these influencing factors do not add moisture to spaces, and thus only effect the sensible cooling load. The sensible portion of the cooling load consists of:
• Heat transfer through the exposed building surfaces
• Heat gain from sunlight through windows
• Heat gain from interior lighting
• Heat gain from equipment operating within the conditioned space
• A portion of the metabolic heat output from occupants
Other sources of internal heating such as occupant respiration/perspiration, cooking, showering, washing and infiltration of humid outside air increase the humidity of inside air. These sources contribute to the latent cooling load as well as the sensible cooling load. In this context, the word latent implies “hidden.” Latent heat gains do not change the temperature of interior air but have a profound impact on human thermal comfort and the total cooling load of the building.
The latent portion of the cooling load consists of:
• Moisture that diffuses through exterior building surfaces due to vapor pressure difference
• Moisture carried in by air infiltration
• Moisture carried in by ventilation air
• Moisture given off by occupant respiration and perspiration
• Moisture given off by cooking, bathing, showering, laundry, interior plants and washing
The total cooling load, at any time, is the sum of the sensible and latent heating loads. This is almost never equal to the sum of the maximum expected rate of heat gain (sensible or latent) attributable to each of the previously stated influencing factors.
For example, the thermal mass of buildings having large exposed interior masonry walls can absorb some of the sensible internal heat gains, especially if that mass has been cooled prior to the occurrence of those sensible heat gains. This causes a time delay between the occurrence of the internal gain and when that energy becomes part of the instantaneous cooling load.
The diversity of the factors that influence total cooling loads in commercial and industrial buildings has been extensively studied over several decades. This study has led to development of detailed methods for determining hourly cooling loads.
The often-cited reference for methods of calculating cooling loads in commercial and institutional building is chapter 18 in the 2017 ASHRAE Book of Fundamentals. The methods recommended by ASHRAE include Radiant Time Series method and Transfer Function Method. These methods include consideration of how all the factors listed above interact over time to determine the building’s cooling load profile.
There are also several commercially available software programs that can be used to estimate sensible and latent cooling loads in commercial and institutional buildings. Some examples include:
Chvac: from Elite software
Block Load (BLK): from Carrier Corporation
Right-N: from Wrightsoft (based on ACCA Manual N)
VENTILATION COOLING LOAD
Commercial and institutional buildings intended for human occupancy require ventilation. The recommended rates of outdoor air supplied to the building vary with the intended occupancy and activity.
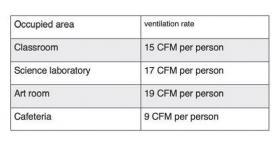
For example, ASHRAE recommends the following ventilation rates in a school building.
Other ventilation rates apply to office and industrial buildings. In general, the greater the potential for undesirable substances such as carbon dioxide, carbon monoxide, aldehydes, smoke, chemical vapors or biological contaminants (e.g., viruses and bacteria) to be created or present in the space, the higher the recommended ventilation rate.
The cooling load associated with providing ventilation depends on the dry-bulb temperature and absolute humidity of the inside and outside air. The sensible portion of the ventilation cooling load is based on the change in dry-bulb temperature between that of the incoming outside air, and the desired delivery temperature and humidity ratio to the occupied spaces. It can be estimated using Formula 4–2:
Formula 4-2
$${q_{\,vent(sensible)}}=1.08(CFM){\bigl(T_{out}-T_s\bigr)}$$
Where:
$qvent_{(sensible)}$ = sensible cooling load due to ventilation (Btu/hr)
$CFM$ = ventilation airflow rate (ft3/minute)
$T_{out}$ = outdoor air dry-bulb temperature (ºF)
$T_s$ = dry-bulb temperature of air delivered to ventilated spaces (ºF)
The latent cooling associated with the ventilation air can be estimated based on the ventilation airflow rate and change in moisture content between outside air and the air supplied to the occupied spaces. It can be estimated using Formula 4-3:
Formula 4-3
$${q_{\,vent(latent)}}=4840(CFM){\bigl(AH_{out}-AH_s\bigr)}$$
Where:
$qvent_{(latent)}$ = latent cooling rate of ventilation air stream (Btu/hr)
$CFM$ = ventilation air flow rate (ft3/minute)
$AH_{out}$= absolute humidity of incoming outdoor air (lbwater/lbdryair)
$AH_s$= absolute humidity of air supplied to the conditioned space (lbwater/lbdryair)
The absolute humidity of air can be read on the vertical axis of a psychrometric chart (shown in Appendix B).
It’s worth noting that condensing water vapor into a liquid to remove it from an air stream is an energy-intensive process. The average heat removal necessary to condense one pound of water from typical summertime air is about 1076 Btu.
Consider a classroom of 29 students and 1 instructor (30 people in total). Based on ASHRAE recommendations, the ventilation air supply should be 15 CFM per person, and thus the ventilation airflow rate would be 450 CFM. If the outdoor air was at 90ºF dry-bulb temperature and 80% relative humidity, its absolute humidity (found on a psychrometric chart) would be 0.0245 pounds of water per pound of dry air. If the ventilation air stream was required to have a delivery temperature of 60ºF and relative humidity of 50%, its absolute humidity would be 0.0056 pounds of water per pound of dry air. Based on these conditions, the total ventilation air cooling load(e.g., the sum of the sensible and latent loads) would be:
Sensible cooling load for ventilation air:
$${q_{\,vent(sensible)}}=1.08(450){\bigl(90-60\bigr)}=\text{14,580} {Btu \over hr} $$
Latent cooling load for ventilation air:
$${q_{\,vent(latent)}}=4840(450){\bigl(0.0245-0.0056\bigr)}= \text{41,164} {Btu \over hr} $$
Total cooling load for ventilation air = 14,580 + 41,164 = 55,744Btu/hr
Under the stated conditions, the cooling capacity needed to lower the temperature of the ventilation air is only about 26% of the total cooling load for the ventilation air. This demonstrates that a large amount of cooling capacity is needed to reduce the moisture level of what — in this case — is “tropical” outside air. Also keep in mind that these calculations only pertain to the cooling load associated with ventilation. The sensible and latent cooling load of the classroom due to other heat gains (lights, solar, etc.) and moisture gains from people and diffusion through building envelope surfaces must be added to the ventilation cooling load to arrive at the total cooling load.
ENERGY RECOVERY VENTILATION SYSTEMS
Some modern air handlers that also control ventilation airflow are equipped with heat recovery or energy recovery devices that capture a portion of the cooling effect available from the exhaust air stream and use it to partially condition the incoming air stream. Heat recovery systems work with sensible heat exchange (e.g., heat transfer based solely on the temperature difference between incoming and leaving air streams ). Energy recovery systems exchange both sensible heat and latent heat. The latter are also sometimes called “enthalpy” recovery systems.
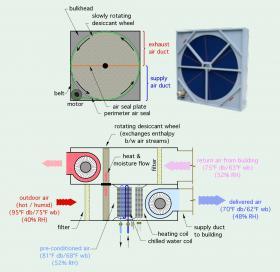
Figure 4-8 illustrates the concept of an air handler containing an “enthalpy wheel.”
The enthalpy wheel is composed of a cellular media that allows air to flow through it. This media contains a desiccant that absorbs moisture when cooled and releases moisture when heated. The upper half of the wheel is in the exhaust duct, while the lower portion of the wheel is in the supply air duct. The wheel is slowly rotated by an electric motor. The media in the lower half of the wheel absorbs heat and moisture from the incoming outside air causing the air temperature and moisture level to drop. This “pre-conditioned” air decreases the cooling and dehumidification load on the downstream cooling coil. The cells that absorbed the heat and moisture eventually rotate into the upper duct, where they release heat and moisture into the exhaust air stream. Enthalpy wheels can significantly reduce the cooling load associated with
building ventilation. They can also recover up to 70% of the thermal energy that would otherwise be exhausted with stale air during the heating season.

