There are different ways to evaluate the hydraulic and thermal performance of existing hydronic circuits.
One approach relies on theoretical modeling of the circuit and its circulator. It starts by finding the circuit’s hydraulic operating point (e.g., the flow rate where head energy added by the circulator equals the head energy loss of the circuit). Once the flow rate is calculated, a thermal analysis of the circuit, based on heat transfer models for the heat emitters and connecting piping, finds a relationship between supply water temperature and heat output.
This “analytical” approach requires a substantial amount of on-site work to document lengths and sizes of piping, fittings count, type and size of heat emitters, and pump curves for all circulators in the system. If the circuit operates with antifreeze, the concentration of that antifreeze also needs to be determined. All this information is required to build hydraulic and thermal models for the circuit.
Another approach is based on physically measuring the thermal performance of a circuit as it operates. This method requires heat input to the circuit, as well as time to allow the circuit to settle to (or very close to) steady state conditions. It also requires accurate measurement of flow rate and temperature drop across the circuit. This approach requires some instrumentation but less data gathering for each circuit. This section describes the overall process.
Measurements Needed
There are two quantities that must to be measured as part of evaluating the heat output of a hydronic circuit:
- Temperature drop (∆T) (ºF)
- Flow rate (gpm)
These measurements will be combined, along with two physical properties of the fluid flowing through the circuit, to calculate its heat dissipation rate.
Temperature Measurements
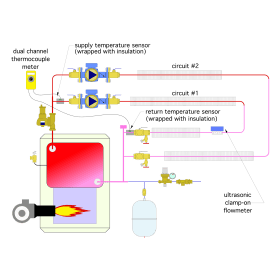
The temperature drop of the circuit can be measured using two identical temperature sensors, such as thermocouples, thermistors or other resistance temperature detectors (RTDs), that are temporarily fastened to the outside of the piping at the beginning and end of the circuit being tested, as shown in figure 3-1.
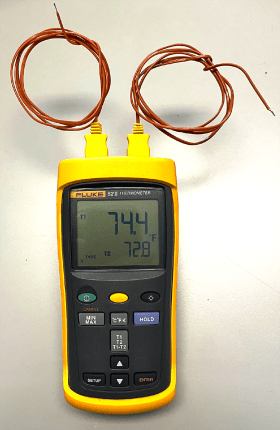
Temperature-measuring instruments that use thermocouple sensors are widely available and relatively inexpensive.
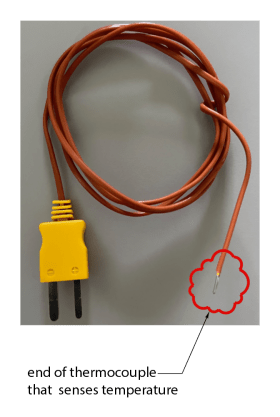
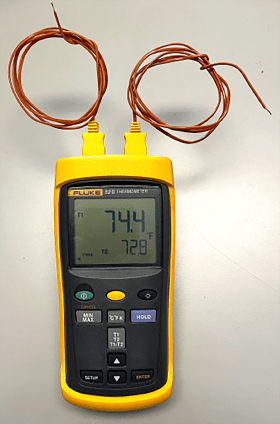
Thermocouples are made by bonding the ends of two wires made of dissimilar metals to form a junction. That junction generates a very small but very repeatable voltage that changes as the temperature of the junction changes. The sensing area of a thermocouple is very small, as shown in figure 3-2.
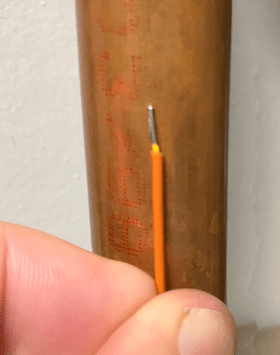
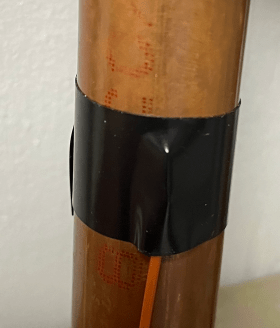
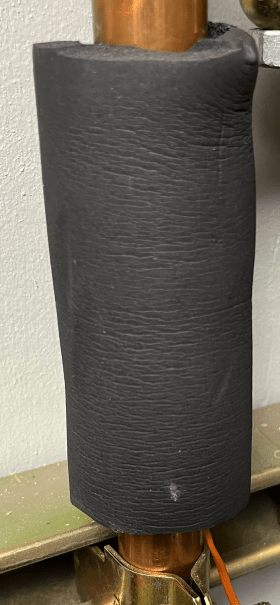
To make a temperature measurement, the end of a thermocouple can be temporarily secured to the outer surface of a pipe using electrical tape. When two thermocouples are used to measure a temperature difference in a hydronic circuit, they should both be mounted to pipe surfaces using identical methods. . After mounting, both thermocouples should also be wrapped with a nominal 3-inch length of elastomeric foam insulation, as shown in figure 3-3. This minimizes the influence of surrounding air temperature on the readings.
Dual channel thermocouple meters typically have a setting for temperature difference (a.k.a., ∆T). These meters can read both sensors at the same instant and calculate the temperature difference. This improves accuracy, since it eliminates the need to change the connections between each sensor and the meter, as would be the case with a single channel meter.
Flow Measurement
There are several ways to measure flow rate in a hydronic circuit. The method used depends on the required accuracy of the measurement and the hardware installed in the existing system.
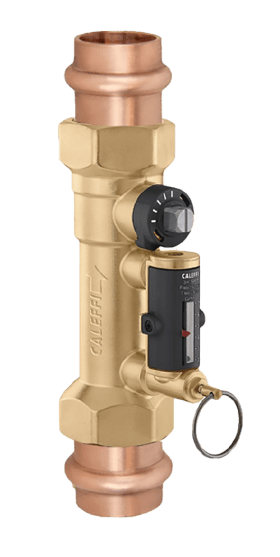
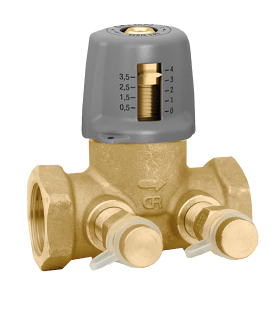
If the circuits for which flow rate needs to be measured have existing balancing valves, such as the Caleffi QuickSetter™ or Flo-Set™, they can be used to measure flow rate to an accuracy of +/-10 to +/-15%.
The QuickSetter™ valve shown in figure 3-5a uses a direct-reading flowmeter and has a specified accuracy of +/-10%.
The Flo-Set™ valve is available with either a fixed orifice or variable orifice. The fixed orifice valve has a specified accuracy of +/-10%. The variable orifice valve has a specified accuracy of +/-15%. Both versions of the Flo-Set™ valve require a manometer to measure the pressure drop across the valve’s orifice, which can then be combined with the valve’s setting to infer flow rate.
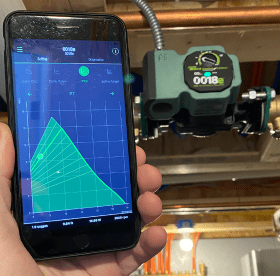
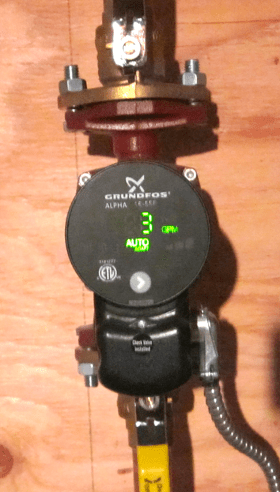
ECM circulators do not directly measure flow rate, they infer flow rate based on the circulator's power input, its RPM, and the internal calculation algorithms. They are capable of +/-5% accuracy when operated under the following conditions:
- They are free from any oxide accumulation or debris.
- They are operating with water (glycol solutions will increase wattage and reduce accuracy).
- They operate to the left of their maximum hydraulic efficiency point.
Another way to measure circuit flow rate is a flowmeter directly installed in the fluid stream. A wide variety of these “inline” flowmeters are available. Some are classified as “float-type” meters (rotameters), which operate based on flow passing through a variable cross sectional area, which lifts a metal “float” within a calibrated transparent tube. Others are based on a turbine or paddle wheel that spins as flow passes through. In general, higher accuracy meters cost more than lower accuracy meters.
However, it’s uncommon to find inline flowmeters permanently installed in existing residential and light commercial hydronic systems. Doing so would add cost, create additional points of potential leakage, and require the system fluid to be free of particles or other debris that could cause the metering device to jamb, become difficult to read or otherwise affect its accuracy.
For purposes of calculating heat transfer rates in residential and light commercial systems, flowmeters with a resolution of 0.1 gpm are suggested. This is especially important for smaller circuits with nominal flow rates of 1 to 3 gpm.
One of the most convenient and accurate devices for measuring flow rates in existing circuits is an ultrasonic flowmeter. These meters do not have flow passing through them. Instead, they clamp to the outside of a pipe.
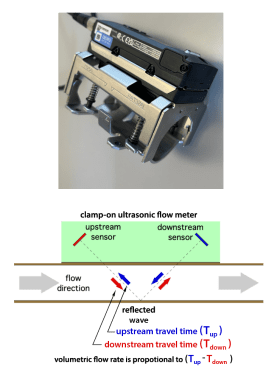
Ultrasonic flowmeters have two sensors that emit and detect a high frequency (ultrasonic) pulse in the range of 0.5 to 4 Mhz. The two sensors are displaced a short distance along the length of the pipe, as shown in figure 3-7.
During operation, the upstream sensor emits an ultrasonic pulse, which travels through the pipe wall and the fluid stream, reflects off the opposite pipe wall, goes back through the fluid stream, through the opposite pipe wall, and is finally detected by the downstream sensor. The time between the pulse being emitted and detected in the direction of flow is very accurately measured.
The function of the two sensors then reverses. The downstream sensor emits an ultrasonic wave at the same frequency, which again passes through the pipe walls and fluid, but in a direction opposite the flow. The time between emission and detection is again very accurately measured. The difference between these two “flight times” is directly proportional to the fluid’s volumetric flow rate.
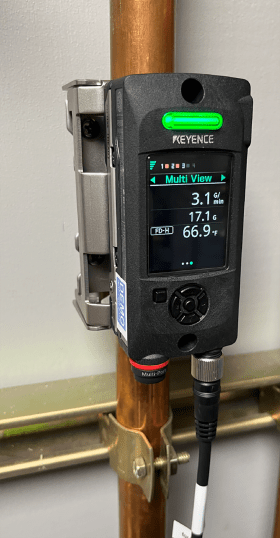
Ultrasonic flowmeter technology has advanced in terms of improved accuracy and lower cost. Meters such as the one shown in figure 3-8 are now available and affordable for heating technicians needing a simple, fast and non-invasive way to accurately measure flow rates.
This meter can be quickly mounted to the outside of a pipe. It can be used with a wide range of pipe materials and sizes, as well as different fluids, and over a wide range of temperatures. Reported accuracy is +/-3% of the reading value. When equipped with optional platinum RTD temperature sensors, the meter shown in figure 3-8 can directly measure the ∆T of a hydronic circuit and combine that measurement with flow rate to calculate the rate of heat transfer.
The meter can be mounted at any location in the circuit since the flow rate is constant throughout. Some meters require minimum straight piping length both upstream and downstream of the meter. Be sure to check the placement requirements when deciding where to mount the meter.
Steady State Conditions
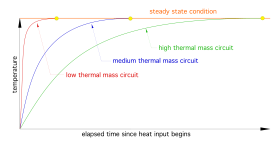
Whenever a hydronic circuit and its associated heat source are turned on, the temperature of everything in the circuit begins to rise. Components with low thermal mass and high thermal conductivity, such as a copper water tube, warm rapidly. Components with much higher thermal mass, such as a cast iron boiler or a concrete floor slab, warm at much slower rates. As these changes occur, the system is said to be operating under transient conditions. Measurements of temperature drop and flow rate under transient conditions do not accurately reflect the performance of the circuit.
If the rate of heat input is stable and continuous, all components in the system, including the fluid at any given location, reach a stable temperature, as shown in figure 3-9. This is called a steady state.
There can be wide variations in the time required for a circuit to reach steady state conditions. Short piping circuits of small-diameter pipe, serving low thermal mass heat emitters such as fin-tube baseboard, and supplied by a low thermal mass heat source, may reach steady state in 10-15 minutes. Longer circuits built with larger piping and serving heat emitters such as cast iron radiators, could take an hour or more to reach steady state. Systems that heat concrete floor slabs can take several hours to reach steady state.
At steady state, the rate of heat input to the circulating fluid equals the rate of heat dissipation from the circuit. This is the condition at which temperature and flow rate measurements should be taken.
Adjusting Circuit Operating Conditions
When the heat output of a heat source is greater than the heat dissipation rate of the distribution circuit — which is almost always true for multi-zone systems with non-modulating heat sources — the heat source will reach its high-temperature limit setting before the circuit reaches steady state conditions. When this occurs, the heat source stops injecting heat to the circuit and the circuit’s temperature starts to decrease as heat is dissipated. After the circuit cools through the differential temperature setting of the heat source’s high limit controller, the heat source will start again. These on/off cycles of the heat source will repeat as long as there is a call for heating. This makes it difficult to attain steady state conditions.
The swing in supply water temperature from the heat source can be reduced by reducing the high-limit temperature setting of the heat source, and also reducing the temperature differential between when the heat source turns on and off. The goal is to find a “warm” fluid temperature, perhaps 20-25ºF above room air temperature, that the heat source can maintain as steady as possible. The fact that this temperature may be well below the normal operating temperature of the circuit can be dealt with using methods presented later in this section. Keeping this temperature relatively low and stable also reduces the time required for the circuit to achieve steady state.
Calculating Heat Transfer Rates
When the flow rate and temperature drop of a circuit are stable (e.g., the circuit is operating at steady state conditions), the rate of heat transfer from that circuit can be calculated using formula 3-1.
Formula 3-1:
$$ Q=8.01Dc(f)(\Delta T)$$
Where:
Q = rate of heat dissipation from circuit (Btu/hr)
D = density of the fluid at the average temperature of the circuit (lb/ft3)
c = specific heat of the fluid at the average temperature of the circuit (Btu/lb/ºF)
f = flow rate through circuit (gpm)
∆T = temperature drop of the circuit at steady state conditions (ºF)
8.01 = a constant based on the units in the formula
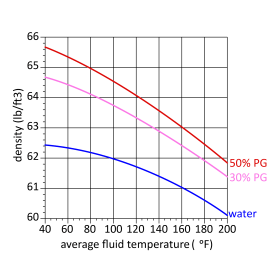
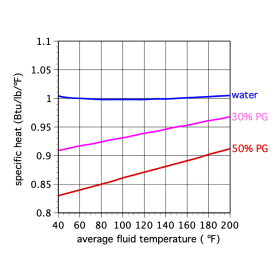
Both fluid properties (e.g., density and specific heat) are functions of the fluid’s temperature. Figure 3-10 shows the density of water as well as 30% and 50% solutions of propylene glycol as a function of temperature. Figure 3-11 shows the specific heat of these same fluids, again as a function of temperature. The density and specific heat of other concentrations of propylene glycol can be estimated from these graphs by interpolation. Use the average temperature of the circuit being tested (e.g., the average of the measured supply and return temperatures) when using these graphs to estimate the fluid’s density and specific heat
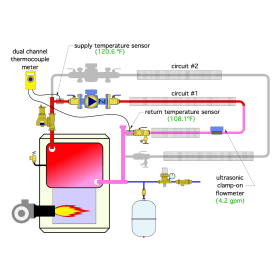
Example: Circuit #1 in the system shown in figure 3-12 is turned on and allowed to reach a steady state condition. A dual temperature meter is used to measure the supply and return temperature of the circuit. The circuit’s supply temperature is 120.6ºF. The circuit’s return temperature is 108.1ºF. A strap-on ultrasonic flowmeter indicates a flow rate of 4.2 gpm. The system operates with a 30%
Solution: Start by finding the average fluid temperature in the circuit.
$$ T_{\text{ave}} = \frac{120.6 + 108.1}{2} = 114.35 \approx 114^\circ F $$
Use figures 3-10 and 3-11 to estimate the density and specific heat of the fluid at this average temperature. . D = 63.5 lb/ft3,c = 0.935 Btu/lb/ºF.
Putting the measured data along with the fluid properties into formula 3-1 yields:
$$ Q = 8.01Dc(f)(\Delta T) = 8.01(63.5)(0.935)(4.2)(120.6 - 108.1) = 24968 \approx 25,000 \, \frac{\text{Btu}}{\text{hr}} $$
The components used for this test do not require depressurization of the system and can be added and removed easily.
The calculations are an instantaneous “snapshot” of the circuit’s thermal performance.
Measuring Circuit Heat Output Using an External Heat Source
It’s also possible to measure the thermal performance of a hydronic circuit without operating that circuit’s heat source. This technique is helpful in situations where the heat source is not operational, or during warm weather testing in which minimal heat release into the space is desirable. The testing method uses a small electrically powered heating device to provide a very stable heat input to the circuit being tested, which expedites achieving steady state conditions.
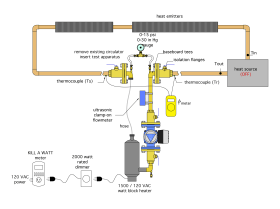
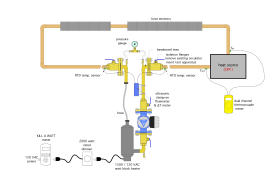
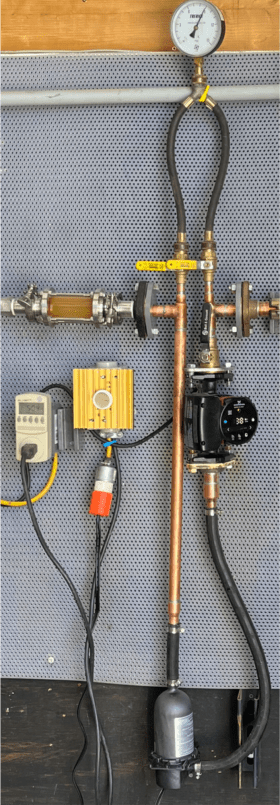
The procedure is based on temporarily removing the circuit’s circulator and installing the test apparatus shown in figure 3-13.
The test apparatus consists of a set of circulator flanges combined with a circulator and an electric block heater. The flanges of the test apparatus connect directly to the isolation flanges of the original circulator, which would be closed prior to removing the original circulator.
Ideally, the test apparatus is filled with the same fluid that’s in the circuit before it is connected to the isolation flanges. Doing so minimizes air entry into the system during the test. If pre-filling is not possible due to the mounting orientation, a small amount of fluid can be added to the system using the feed water valve or glycol fluid feeder.
Each flange of the apparatus connects to a baseboard tee fitting. The small 1/8" FPT port on each baseboard tee can be connected to a pressure gauge using two small ball valves and small-diameter tubing.
In systems with relatively low static pressure at the location of the test apparatus, a pressure gauge rated for 0-15 psi should work. In systems with higher static pressure at the location of the test apparatus, a 0-30 psi gauge can be used.
The purpose of the gauge is to measure pressure drop around the circuit at different flow rates, which enables a circuit head loss curve to be developed. The latter can be used to evaluate how the circuit might perform using a different circulator, or a specific speed setting on a multi-speed circulator.
A procedure for operating this apparatus to determine the circuit head loss curve is given in Appendix C. If the differential pressure characteristics of the circuit are not needed, the 1/8" FPT ports on the baseboard tees can be closed with threaded plugs.
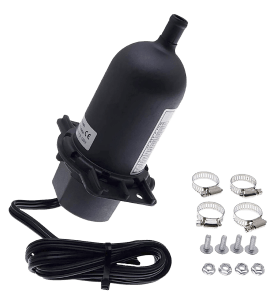
An electric block heater, such as the one shown in figure 3-14, is used to thermally “excite” the circuit.
These block heaters are intended to preheat the coolant in vehicle engines during very cold weather. They consist of an electric heating element housed in a small vessel. Most are designed to be connected with hoses and have nominal heating capacity of 1,000 to 1,500 watts (3,413 to 5,120 Btu/hr).
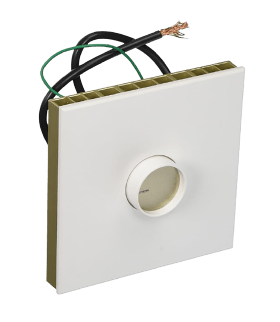
Power input to the block heater can be controlled by a suitably rated dimmer switch, such as the 2,000 watt rated dimmer shown in figure 3-15.
Some ultrasonic flowmeters are also capable of monitoring two temperature sensors. As such they can simultaneously capture flow rate and differential temperature, making them capable of calculating the instantaneous rate of heat transfer. If this type of meter and its associated sensors are mounted on the test apparatus, and a dual channel thermocouple meter is also available, mount the thermocouples for the dual channel meter across the inactive heat source as shown in figure 3-18.
Thermal Test Procedure (For Zone Circulator Systems)
The following procedure is for systems using zone circulators, such as those shown in figure 3-20.
Before installing the test apparatus, secure the ultrasonic flowmeter to one zone circuit, turn the existing heat source off, and turn on all zone circulators. This allows measurement of the flow rate in the zone being tested under hydraulic conditions that simulate design load (e.g., assuming all zone circulators are on under design load). With all zone circulators operating, there is maximum flow, and thus, maximum head loss through the common piping. This condition results in the lowest flow rate through the zone being tested.
If the zone circulators are hydraulically separated from each other, there will be a minimal drop in zone flow rate with all zone circulators operating. However, if the degree of hydraulic separation is marginal, there may be a noticeable drop in the zone flow rate with all zones operating relative to what the zone flow rate would be as the only operating zone. The most “conservative” condition for measuring flow rate is with all zone circuits operating.
After recording the flow rate in the zone being tested under the above conditions, move the ultrasonic flowmeter to another zone and repeat the process. Do this for each zone in the system, recording the flow rate produced within each zone by its associated zone circulator.
Next, install the test apparatus in place of the existing circulator in one zone, and follow these steps.
- Turn on the test circulator and adjust its speed while monitoring the flow rate through the ultrasonic flowmeter. Establish a flow rate approximately equal to the previously recorded flow for that zone.
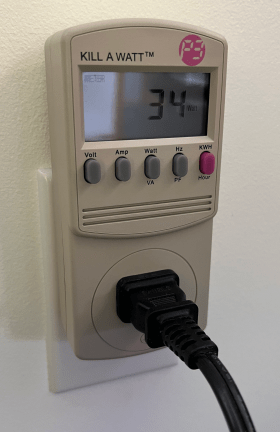
- Plug in and power up the electric block heater. Adjust the dimmer switch controlling power input to the block heater to 500 watts input, as indicated by the watt meter.
- Allow the circuit to stabilize to steady state, then measure the supply and return fluid temperatures.
- If necessary, adjust the power input to the block heater so that the supply fluid temperature is at least 20ºF above the room air temperature where the heat emitters are located.
- Allow the circuit to stabilize to steady state whenever there is a change in power input.
- Read and record the supply temperature, return temperature, zone room air temperature, and flow rate.
- If the zone flow passes directly through the inactive heat source, use the procedure in the next subsection (ACCOUNTING FOR HEAT LOSS THROUGH AN INACTIVE HEAT SOURCE) to measure the temperature drop across that heat source.
- Move the thermocouples and flowmeter to another zone and repeat this procedure for all zones in the system.
- After gathering the temperatures, flows and power input for each zone, use formula 3-2 to convert the input power for each zone to Btu/hr.
Formula 3-2:
$$ {Btu \over hr} = (wattage)3.413$$
Where:
Btu/hr = heat dissipation rate for zone (Btu/hr)
wattage = power input to the electric block heater at steady state (watts)
3.413 = conversion factor
Accounting For Heat Loss Through An Incentive Heat Source
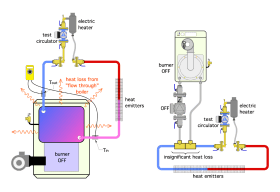
If the electric block heater is being used to heat the circuit, AND the circuit passes directly through an inactive heat source, such as a cast iron boiler, there will be heat dissipation from that heat source. This heat loss would not be present under normal operating conditions when the boiler is operating and supplying heat to the circuit.
If the heat source is indirectly connected to the circuit, as shown in figure 3-21, there should be no flow through it when its dedicated circulator is off. In this case, the heat loss from the inactive heat source, although not zero, should be very small, and can be ignored.
When the circuit flow passes directly through the heat source, the temperature drop across that heat source should be measured using a dual channel thermocouple meter. This measurement should be taken as soon as possible after measuring the supply and return temperature of the circuit, and with the circuit operating at steady state conditions. Having an extra set of thermocouples for the dual channel meter, installed across the inactive boiler as shown in figure 3-18, allows for a rapid switch of sensors. After these measurements are taken, the heat loss across the inactive heat source can be calculated using formula 3-3:
Formula 3-3:
$$q_{hs} = 8.01Dc(f)(T_{in} - T_{out})$$
Where:
qhs= heat loss of inactive heat source (Btu/hr)
D = density of the fluid at the average temperature of the circuit (lb/ft3) (from figure 3-10)
c = specific heat of the fluid at the average temperature of the circuit (Btu/lb/ºF) (from figure 3-11)
f = flow rate through the circuit (gpm)
Tin = fluid temperature entering the inactive heat source (ºF)
Tout = fluid temperature leaving the inactive heat source (ºF)
8.01 = a constant based on the units in the formula
The values for density (D), specific heat (c), and flow rate (f) are the same as those used in formula 3-1. So is the flow rate. The only difference between formulas 3-3 and 3-1 are the temperatures.
The “net” heat output of the circuit would be the value from formula 3-1 minus the value from formula 3-3. This can be expressed as formula 3-4.
Formula 3-4:
$$ q_{\text{cnet}} = (8.01cD) f \left[ \left( \Delta T_{\text{circuit}} \right) - \color{blue}{\left( \Delta T_{\text{ihs}} \right)} \right] $$
Where:
qcnet = net rate of heat output from circuit (Btu/hr)
8.01 = a unit constant
c = fluid specific heat (Btu/lb/ºF)
D = fluid density (lb/ft3)
f= flow rate in circuit (gpm)
∆Tcircuit = the temperature difference across the test flanges (Ts - TR) (ºF)
∆Tihs = the temperature drop across the inactive heat source (Tin-Tout) (ºF)
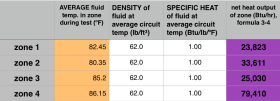
A spreadsheet table such as shown in figure 3-22a can be used to keep the test data organized.
The system fluid is water.
The green cells in figure 3-22a are all measurements taken during the testing.
Once this data is collected, additional columns can be added to process the data using formula 3-4. This formula requires a value for the fluid density (D) and fluid specific heat (c) at the average temperature of each circuit. These can be found using figures 3-10 and 3-11.
Figure 3-22b is an extension of the spreadsheet in figure 3-22a. It shows the values for average water temperature, as well as the density and specific heat of water at the average water temperature in each circuit. The purple column on the far right is the value for net heat output of each circuit, calculated using formula 3-4.
Notice that the density and specific heat of water have the same values for all zones. This is the result of the accuracy of estimating these values from figures 3-10 and 3-11, as well as the small spread of the average circuit temperatures and the inherent characteristics of water. Antifreeze solutions, especially in systems that have a wider spread in average circuit temperatures, would likely reveal changes in density and/or specific heat from one zone to another.
Thermal Test Procedure (For Zone Valve Systems)
It’s also possible to estimate the thermal performance of systems that use zone valves using a procedure like that used for systems with zone circulators.
In systems with zone valves, the flow rate through individual zones can change whenever a different zone turns on or off. The change in flow rate for a given zone as other zones turn on and off depends on the flow resistance of the common piping (e.g., the supply header, return header, and heat source). It also depends on the ability of the system to minimize changes in differential pressure across the circulator as zones turn on and off.
An “ideal” zone valve distribution system would have very low hydraulic resistance through the common piping and a variable-speed circulator that can maintain constant differential pressure regardless of the number of zones operating.
Before installing the test apparatus, secure the ultrasonic flowmeter to one zone circuit, turn the existing heat source off, and manually open all zone valves. Turn on the existing circulator. If a variable-speed circulator is used, set it to operate at maximum speed. This allows the flow rate in the zone being tested to be very close to its value under design load conditions (e.g., assuming that all zones are on, and that a variable-speed circulator — if present — is at full speed under design load). When all zone valves are open, there is maximum head loss through the common piping and the lowest operating flow rate through the zone being tested.
After recording the flow rate in the zone being tested, and under the above conditions, move the ultrasonic flowmeter to another zone and repeat the process.
Do this for each zone in the system, recording the flow rate produced in each zone by its associated zone circulator.
At this point, the nominal flow rate that each zone would operate at under design load conditions has been established.
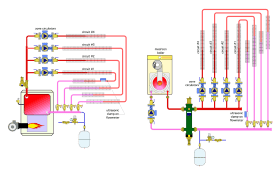
Next, install the test apparatus in place of the existing circulator as shown in figure 3-23, and follow these steps.
- Manually open ALL zone valves.
- Attach the ultrasonic flowmeter to the piping in one zone.
- Turn on the test circulator and adjust its speed while monitoring the flow rate in the zone. Establish a flow rate approximately equal to the previously recorded flow rate for that zone.
- Plug in and power up the electric block heater. Adjust the dimmer switch controlling power to the block heater to 500 watts input, as indicated by the watt meter.
- Allow the circuit to stabilize to a steady state, then measure the supply and return fluid temperatures.
- If necessary, adjust the power input to the block heater so that the supply fluid temperature is at least 20ºF above the room air temperature where the heat emitters are located.
- Allow the circuit to stabilize to steady state conditions after making any changes to the circuit’s power input.
- Read and record the supply temperature, return temperature, zone air temperature, and flow rate.
- If the zone flow passes directly through the inactive heat source, use the procedure in the previous subsection (ACCOUNTING FOR HEAT LOSS ACROSS AN INACTIVE HEAT SOURCE) to measure the temperature drop across that heat source.
- Move the thermocouples and flowmeter to another zone and repeat this procedure for all zones in the system.
- Use formula 3-2 to convert the input wattage for each zone to Btu/hr.
- Set up tables like those in figure 3-22a and 3-22b to keep the measurements and subsequent calculations organized.
Formula 3-2:
$$ {Btu \over hr}=(wattage)3.413 $$
Where:
Btu/hr = heat dissipation rate for zone (Btu/hr)
wattage = power input to the electric block heater at steady state (watts)
3.413 = conversion factor
Estimating Circuit Performance at Other Temperatures
At this point, the circuit testing and subsequent calculations have produced a data point (net heat output (qnet)) and the associated fluid supply temperature at which that heat output occurred.
This information can be used to “calibrate” a simplified relationship between the supply water temperature to a circuit and its heat output. That relationship is given by formula 3-5.
Formula 3-5:
$$ q_{\text{circuit}} \approx k(T_s - T_{\text{air}}) $$
Where:
qcircuit = estimated heat output of the circuit (Btu/hr)
k = a constant to be determined for the circuit (Btu/hr/ºF)
Ts = supply water temperature to the circuit (ºF)
Tair = air temperature in space where the circuit is located (ºF)
Put in words, formula 3-5 states that the heat output of a circuit is approximately proportional to the difference between the supply water temperature and the air temperature surrounding the circuit.
There are some simplifying assumptions and approximations in formula 3-5.
First, the formula “linearizes” some effects that are primarily driven by natural convection heat transfer. These effects are more pronounced for fin-tube baseboard and panel radiators, both of which transfer some of their heat output by natural convection. The linearization has minimal effect on heat emitters such as radiant floor or ceiling panels, fan-coils or air handlers.
Second, most hydronic circuits have piping in both conditioned (e.g., intentionally heated) spaces, as well as unconditioned (e.g., unintentionally heated) spaces. Thus, some of the piping will not be losing heat to surrounding air at the same temperature as the air in conditioned space. Formula 3-5 is based on a single air temperature. Circuits with minimal amounts of piping in unconditioned space, or well-insulated piping in unconditioned space, will be well modeled by formula 3-5. Many current energy codes require minimum insulation levels on all piping carrying heated fluids through unconditioned spaces.
These assumptions and approximations are generally acceptable based on the intended purpose of the circuit testing and the accuracy of the measurements from the testing process.
Based on the tests described earlier, there is a known value for the circuit’s net heat output (qnet) and the supply fluid temperature (Ts) at which this output occurred. This can be used to find the value of (k) in formal 3-5.
Example: Based on testing, a hydronic heating circuit has a net heat output (qnet) of 15,500 Btu/hr when supplied with fluid at a temperature of 125ºF. Use formula 3-5 to find the value of k for this circuit, assuming that the air temperature surrounding the majority of the heat emitters and piping is 68ºF.
Solution: Rearrange formula 3-5 and insert the known information to find the value of k.
$$k = \frac{q_{\text{net}}}{(T_s - T_{\text{air}})} = \frac{15,500}{(125 - 68)} = 271.9 \, \frac{\text{Btu}}{\text{hr} \cdot ^\circ F}$$
The value of (k) can be interpreted as follows: This specific circuit releases approximately 272 Btu/hr for each ºF its supply fluid temperature is above the air temperature surrounding the circuit.
After the value of (k) has been determined, it’s possible to estimate the heat output of the circuit at other fluid supply temperatures and other air temperatures. This can be done analytically using the value of (k) in formula 3-5, along with the fluid supply temperature and the desired surrounding air temperature.
Example: Assuming the (k) value of 271.9 Btu/hr/ºF from the previous example, estimate the heat output of the same circuit when supplied with fluid at 105ºF, and within a space where the air temperature surrounding the heat emitters and piping is 70ºF.
Solution: Putting the information into formula 3-5 and calculating yields:
$$q_{\text{net}} = k(T_s - T_{\text{air}}) = 271.9(105 - 70) = 9,517 \, \frac{\text{Btu}}{\text{hr}}$$
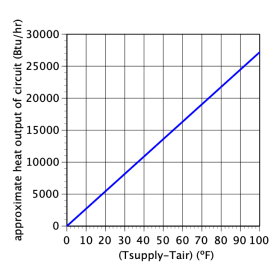
It’s also possible to make a graph of formula 3-5 using the value of (k) for the specific circuit, as shown in figure 3-24.
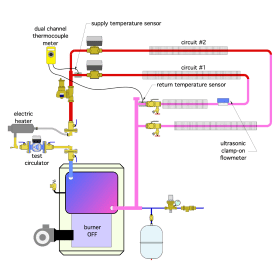
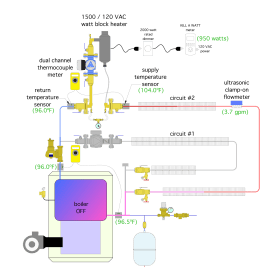
Example: Zone circuit #2 in the hydronic system shown in figure 3-25 was tested using the methods described in this section.
The circuit achieved a steady state condition when the power supplied to the electric block heater was 950 watts. At this point, the supply temperature to the circuit was 104ºF, and the return temperature was 96ºF. The air temperature surrounding most of the circuit during the test was 68ºF.
The ultrasonic flowmeter attached to the circuit indicated 3.7 gpm flow. The circuit operated with a 30% solution of propylene glycol antifreeze. The circuit passed through an inactive boiler, across which the temperature drop was 0.5ºF. Determine:
a. The net heat output of the circuit including that from the inactive boiler.
b. The approximate heat output of the circuit if it operated with a supply temperature of 120ºF, and a surrounding air temperature of 70ºF.
Solution: Start by finding the average fluid temperature in the circuit:
$$T_{\text{ave}} = \frac{T_{\text{supply}} + T_{\text{return}}}{2} = \frac{104 + 96}{2} = 100^\circ F$$
Using figure 3-10 to find the density of the 30% propylene glycol solution at 100ºF.
D = 63.7 lb/ft3
Use figure 3-11 to find the specific heat of the 30% propylene glycol solution at 100ºF.
c = 0.93 Btu/lb/ºF
The temperature drop around the circuit is: ∆Tcircuit = 104.0 - 96.0 = 8.0ºF
The temperature drop across the inactive heat source is: ∆Tihs = 0.5ºF
Putting these values along with the measured flow rate into formula 3-4 yields:
$$q_{\text{net}} = (8.01cD) f \left[ \left( \Delta T_{\text{circuit}} \right) - \color{blue}{\left( \Delta T_{\text{lhs}} \right)} \right] = (8.01)(0.93)(63.7)(3.7)\left[ (8.0) - \color{blue}{(0.5)} \right] = 13,168 \, \frac{\text{Btu}}{\text{hr}}$$
The value of (k) for this circuit is found using formula 3-5:
$$k = \frac{q_{\text{net}}}{(T_s - T_{\text{air}})} = \frac{13,168}{(104 - 68)} = 365.8 \, \frac{\text{Btu}}{\text{hr} \cdot ^\circ F}$$
Formula 3-5 can now be used to estimate the circuit’s heat output at the new stated conditions:
$$q_{\text{net}} = k(T_s - T_{\text{air}}) = 365.8(120 - 70) = 18,290 \, \frac{\text{Btu}}{\text{hr}}$$
The techniques discussed in this section represent a minimally invasive approach for physically testing existing hydronic heating circuits to estimate their performance over a range of fluid supply temperatures and surrounding air temperatures.
The objective in getting this information is to estimate the performance of the existing circuit at conditions other than those at which it currently operates, such as when a new heat source will be used and the circuit operated at a reduced supply water temperature.
Consider the following scenario: An existing circuit of fin-tube baseboard operates at an average supply water temperature of 170ºF. A designer is considering adding an air-to-water heat pump to the system to either replace the boiler or act as a primary heat source, with the boiler serving as a supplemental and backup heat source. The designer wants to estimate the output of the existing circuit at a supply temperature of 120ºF. They know that the heat output will be lower but not how much lower. Based on the methods described, the designer can determine what modifications to the circuit or what changes to the building might be necessary to allow the circuit to maintain comfort in the space at the lower fluid supply temperature.
For more information on reducing water temperature in existing hydronic heating systems, see idronics #25
Measuring Energy Transfer Over Time
While this section has focused on how to measure the rate of heat output from hydronic circuits, some situations require ongoing measurement of total heat transferred over time. That information could then be the basis for invoicing for thermal energy usage.
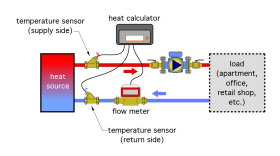
Figure 3-26 shows an energy metering assembly that can be installed to measure both instantaneous rate of heat transfer, as well as the total amount of heat transferred over time.
The two temperature sensors and the flowmeter provide information to a heat calculator that can determine the instantaneous rate of heat transfer and the total amount of heat that has passed from the heat source to the load over time.
For more information on Fundamentals of Heat Metering in Hydronic Systems, see idronics #24


